 |
| Jacques Bertin wrote the seminal book: Semiologie Graphique (Semiology of Graphics) |
|
|
For Bertin Information is:
"A series of correspondences observed within a finite set of variational concepts (the translatable content of a thought)."
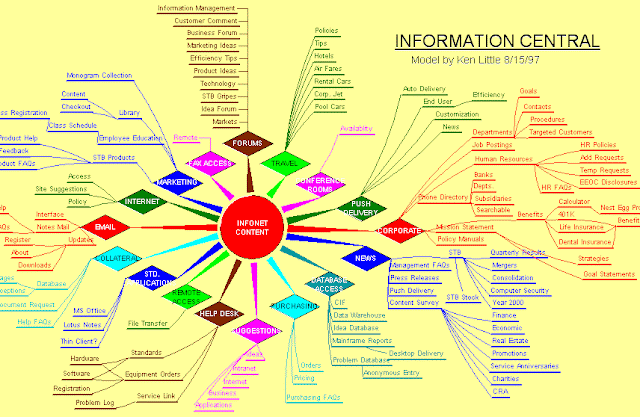
Therefore, let us first see the examples below, then observe these graphics, and finally understand if the information conveyed, by these "artifacts", has been transferred and makes sense for our different points of views and intellects.
Moreover, the "content" should have been facilitated by the 'container': [by the way these are content maps, in contrast with mind maps, or mind-mapping, that is.]
 |
| This graphic or infograph is a good starting point |
|
|
|
 |
| Therefore we can use "six eyes" |
|
 |
| Are you have any interview or any meeting? |
 |
| OK, Money, especially nowadays that we are facing all types of financial breakdowns and European Community is facing, perhaps, the end of its financial union. |
|
|
 |
Here we "have" on one page a whole "Tutorial on Writing", which was developed by Dr.
Gavin Budge from UCE Birmingham, School of English. The work was sponsored
by a grant from the English Subject Centre in UK. Gavin Budge studied at the
Universities of Cambridge and London, where he gained his PhD, and his research
interests are in Romantic and Victorian literature. This is just great!
I can believe it, this is the most complex object and here it is depicted just as a model [of the brain] showing a combined hierarchical and network structure. |


No comments:
Post a Comment